

Neuromarketing Research
.CO Domain
As part of my master's thesis, I conducted a research study with 306 participants using a mixed-methods approach that combined qualitative and quantitative techniques, including web-based eye tracking and image click analysis, two tools that proved especially useful in confirming my hypothesis.
The study tested visual stimuli made up of two images: one with a plain background and one with a photographic background.
By defining Areas of Interest (AOIs) within each image, the tools generated measurable results that helped compare visual attention and engagement. These insights supported the development of a neuromarketing plan to position the .CO domain in Colombia.
The research also identified two distinct target audiences for GoDaddy Registry, each requiring tailored messages that address their specific pain points.
On this page, I’ll be sharing the tools I found most effective and the highlights that shaped my strategic recommendations.
A/B TESTING
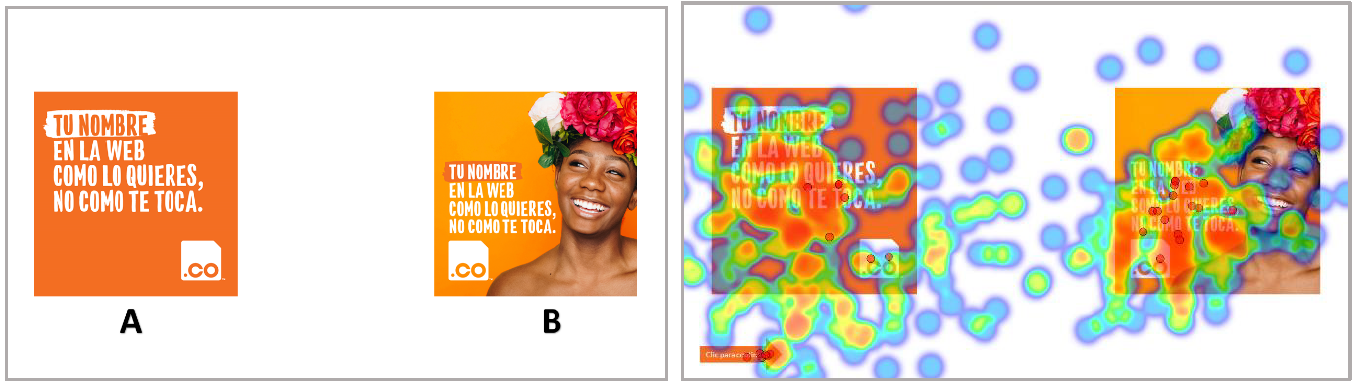
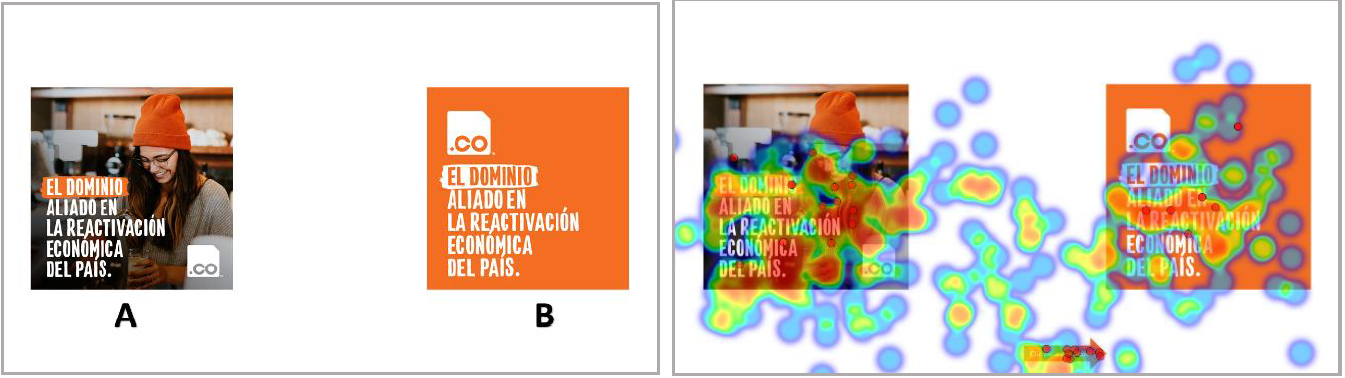
The heat map results showed that, in both cases, the text was the main point of visual focus, while the logo drew little to no attention.
When analyzing each Area of Interest (AOI), image A received 7 clicks, while image B received 16, suggesting a clear preference for the image with a photographic background over the one with a flat color.
Although both images had the same average viewing time (2.34 seconds), and image A recorded slightly more visual fixations (115 vs. 105), this did not translate into preference.
Image B generated a click in just 3.79 seconds on average, while image A took 7.33 seconds.
In short, image B’s AOI not only attracted more clicks but did so in nearly half the time, indicating stronger engagement and quicker action.
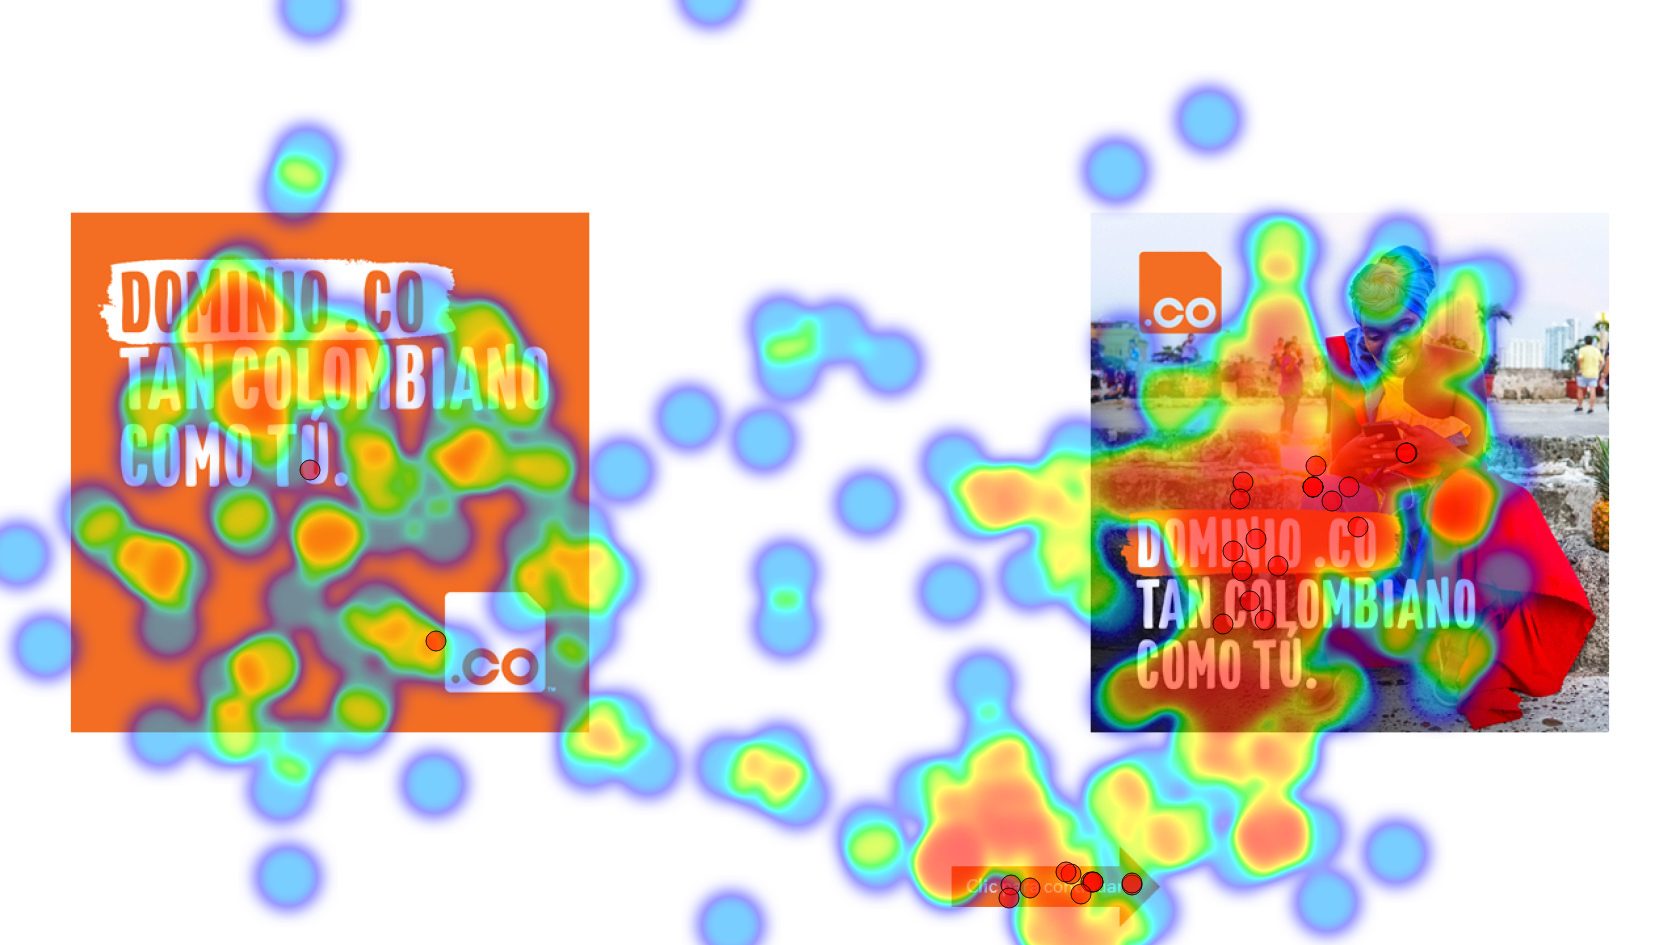
The heat map clearly showed a strong visual preference for the image on the right. Viewers focused mainly on the text and the upper part of the woman’s body, while the logo received no visual attention.
AOI data revealed that image A received only 2 clicks, while image B received 18, a significant difference that highlights a strong preference for photographic imagery.
Although image A was seen more quickly (1.09 seconds vs. 2.73), image B generated far more fixations (152 vs. 74), indicating deeper interest.
The time to first click was nearly the same for both, but the level of engagement with image B, measured by attention, frequency of gaze, and number of clicks, was consistently higher.
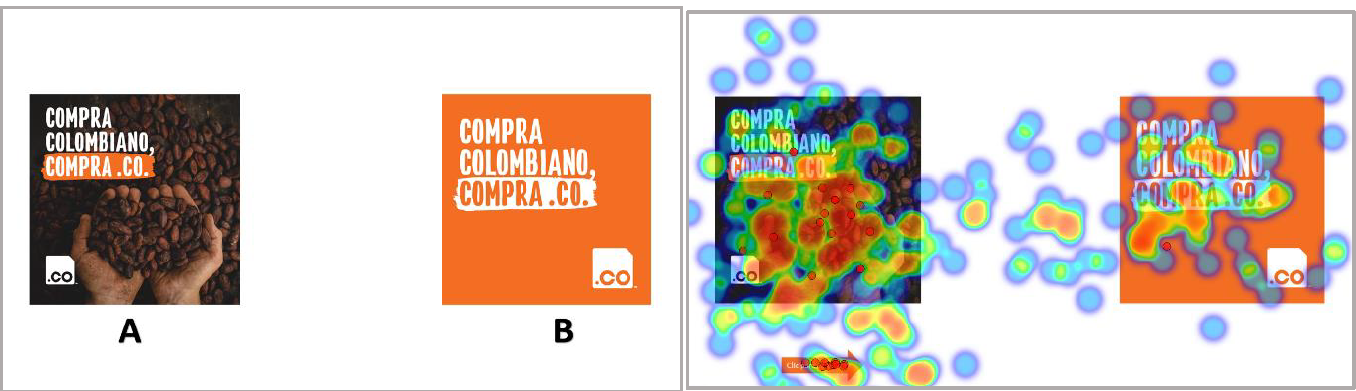
The heat map revealed a clear fixation preference for the photographic image, especially around the subject’s hands.
Once again, the logo went unnoticed.
Image A, which featured a photo, received 18 clicks, while image B received only 1—reinforcing the consistent pattern of preference for visual content with real-life imagery. Average viewing time was 2.6 seconds for image A and 1.24 seconds for image B.
The first click on image A occurred at 4.1 seconds, while image B required 7.93 seconds, nearly twice as long.
These findings align with earlier results, confirming that photographic images not only attract more attention but also prompt faster actions.
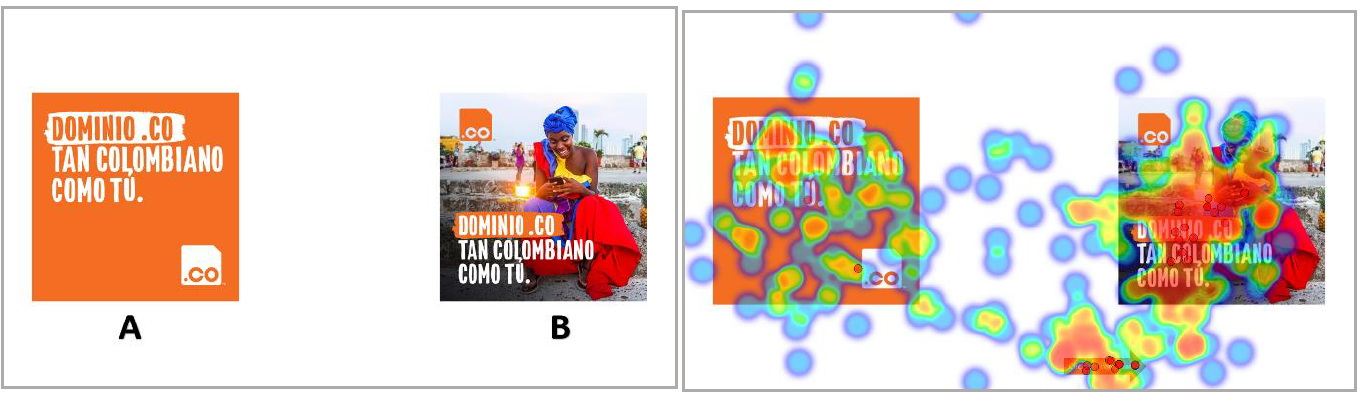
The heat map showed that viewers spent significantly more time on the left AOI, focusing both on the text and the woman’s gaze.
This suggests a strategic opportunity: placing key elements at eye level within a photo can increase visual engagement.
In terms of click data, image A received 14 clicks versus 8 for image B.
Average viewing time was 2.31 seconds for A and 1.53 seconds for B—consistent with the broader findings of the study.
Image A also prompted a faster response, with the first click occurring at 3.98 seconds, compared to 6.77 seconds for image B.
Overall, images featuring people, especially with visible gaze direction, tend to drive quicker decision-making than those with flat backgrounds.